
Introduction
Are you wasting marketing dollars on the wrong channels? In today’s fast-evolving digital marketing landscape, understanding the customer journey is more critical than ever. When I implemented a Multi-Touch Attribution (MTA) solution for a leading bank, I saw firsthand how precise attribution can transform marketing performance. By reallocating ad spend from low-converting display ads to high-performing email retargeting, we reduced cost per acquisition (CPA) by 20%. Additionally, we discovered that webinar attendees convert at twice the rate of generic ad viewers, allowing for smarter targeting and higher ROI. In this article, I’ll share key insights from my experience and outline how to successfully implement an MTA solution.
What is Multi-Touch Attribution?
A customer’s journey refers to the series of interactions and touchpoints a person experiences with a brand before making a purchase. These touchpoints can include website visits, emails, social media engagements, and more. MTA is a method used to determine the contribution of each touchpoint in this journey toward conversion.
Different Paths to MTA Success
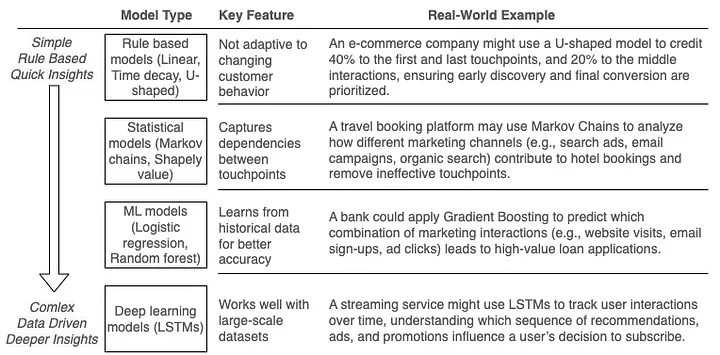
There are several approaches to MTA, each with its own method for distributing credit across touchpoints. The linear attribution model gives equal credit to all touchpoints, while the time decay model assigns more credit to interactions closer to the conversion, reflecting their higher influence. Another model, U-shaped attribution, emphasizes the first and last touchpoints, with the rest of the credit spread across the middle.
However, the approach we will focus on is data-driven attribution (DDA). DDA uses machine learning to analyze historical data and determine the true contribution of each touchpoint based on customer behavior. Unlike predefined models, DDA adapts to individual customer journeys and provides more precise insights.
Where Does the Data Come From?
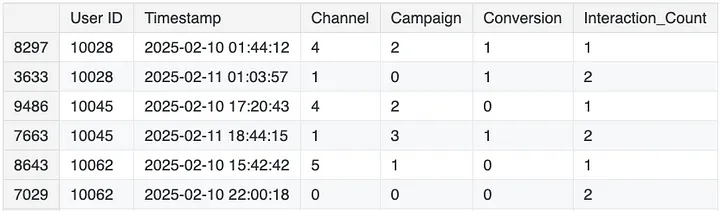
MTA relies on granular, user-level data collected from various sources to map the customer journey. The data typically includes a User ID (unique identifier for each customer), a Timestamp (time of interaction), the Channel (e.g., email, social media, search ads), the Campaign (specific campaign tied to the interaction), and information on Conversion (whether a conversion occurred and its value).
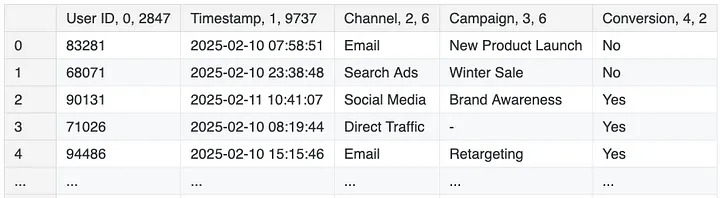
Detailed View of User and Timestamp Data
Key data sources include:
- Web: Tools like Adobe Analytics and Google Analytics track user interactions and conversions via tracking pixels and URL tagging, helping monitor campaign performance.
- Webinar: Platforms like Zoom and On24 provide attendee engagement and registration data, while post-webinar surveys capture feedback and journey insights.
- Email: Platforms like Mailchimp track open rates, click-through rates, and conversions, using unique links to attribute results to specific campaigns.
- Social Media: Facebook Insights and LinkedIn Analytics measure engagement and conversions, while tools like Hootsuite track brand mentions and ad performance.
- Search: SEM (e.g., Google Ads) drives traffic, while SEO improves organic visibility. Search data also reveals customer intent for strategy refinement.
- Call: Tools like CallRail track call sources and link them to campaigns, with post-call surveys offering additional journey insights.
- CRM & Marketing Automation: Systems like Salesforce centralize customer data, while platforms like Marketo analyze cross-channel journeys.
Preparing the Data
MTA data originates from multiple sources, so the first step is to ingest and store it in a data lake using tools like AWS Glue or Databricks. We then perform mapping and transformation to consolidate disparate data into a unified view within the data warehouse, leveraging the same tools.
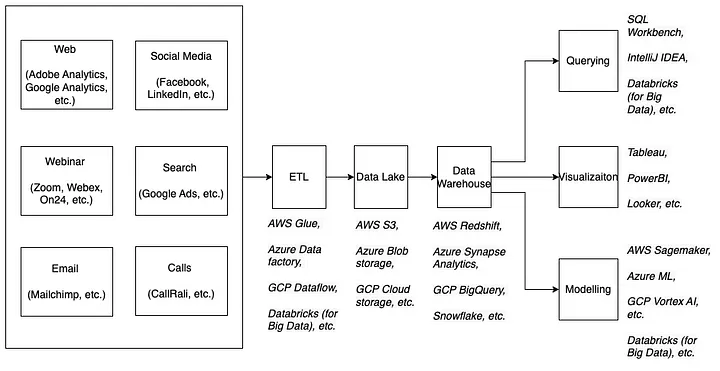
Mapping Data Sources, Infrastructure, and Tools for Seamless Processing
With this unified dataset, we begin pre-processing to ensure data quality. Handling missing values is crucial-this may involve filling gaps with statistical measures (mean, median, or mode) or removing incomplete records. We also encode categorical variables, such as channels and campaigns, into numerical representations (e.g., one-hot or label encoding) to make them suitable for machine learning.
Next, feature engineering enhances model performance by extracting meaningful patterns. Time-based features (e.g., day of the week, hour of the day) reveal optimal interaction periods, while engagement metrics (e.g., time since last interaction, total interaction time) help quantify user behavior. Additional features, such as channel and campaign diversity or conversion-based metrics (e.g., previous conversions, conversion rate), further refine the dataset.
Finally, the processed data is split into training and test sets, ready for modelling.
The Machine Learning Approach
With the data processed, the next step is to apply machine learning models to predict conversions and assess the impact of different marketing touchpoints.
Aggregated User Insights from Timestamp Data
Logistic Regression is an ideal starting point since our target variable, Conversion (1 or 0), represents a binary classification problem. In this model, each feature contributes a weighted effect toward the probability of conversion. After training, the model’s coefficients provide valuable insights into feature importance. For example, if the coefficient for Interaction_Count is 0.83, it means that for each additional interaction, the odds of conversion increase by a factor of e⁰.83 ≈ 2.3, highlighting the strong influence of user engagement.
# Model development

# Logistic Regression
model = LogisticRegression() # Initialize the logistic regression model
model.fit(X_train, y_train) # Train the model
y_pred = model.predict(X_test) # Make predictions

# XGBoost
model = XGBClassifier() # Initialize the XGBoost model
model.fit(X_train, y_train) # Train the model
y_pred = model.predict(X_test) # Make predictions
While Logistic Regression offers interpretability, XGBoost (Extreme Gradient Boosting) is a more advanced approach capable of capturing non-linear relationships and feature interactions. Unlike linear models, XGBoost builds decision trees sequentially, with each tree learning from the errors of the previous one. This makes it particularly effective for identifying complex patterns in marketing data, such as how different channels, campaigns, and interaction frequencies contribute to conversions.
# Model validation

# Calculate accuracy
accuracy = accuracy_score(y_test, y_pred)
print(f'Accuracy: {accuracy:.2f}')

# Display confusion matrix and classification report
print(confusion_matrix(y_test, y_pred))
print(classification_report(y_test, y_pred))

# Visualizing confusion matrix with a heatmap
cm = confusion_matrix(y_test, y_pred)
plt.figure(figsize=(6,5))
sns.heatmap(cm, annot=True, fmt="d", cmap="Blues", xticklabels=[0,1,2], yticklabels=[0,1,2])
plt.xlabel("Predicted Label")
plt.ylabel("True Label")
plt.title("Confusion Matrix")
plt.show()
To ensure the reliability of these models, validation on historical data is essential. The dataset is typically split into training and test sets to evaluate performance on unseen data. Metrics such as AUC-ROC, precision-recall, and accuracy help measure how well the models generalize. Additionally, a time-based validation approach, where past data is used for training and more recent data for testing, ensures the models can adapt to evolving marketing trends. By leveraging both models-Logistic Regression for explainability and XGBoost for predictive accuracy-and validating them on historical data, businesses can build a robust, data-driven attribution strategy.
To complement this process, the linked Kaggle notebook provides a hands-on example of MTA implementation, covering the complete workflow from data preparation to model evaluation. It also includes practical Python code snippets for encoding categorical data, building machine learning models, and assessing their performance.
Closing Thoughts
To wrap up, here are some questions to consider:
- How does your organization currently measure attribution?
- What are the challenges you face in implementing MTA?
- How can machine learning improve your current attribution approach?
Multi-touch attribution is an evolving field, and Machine Learning provides powerful tools to analyze and optimize marketing performance. Start exploring MTA today to gain deeper insights into your customer journeys!
Framework code can be found here: Kaggle
Originally published on LinkedIn