
What are Self Organizing Maps (SOMs)?
SOM stands for Self-Organizing Map, which is a type of artificial neural network that is used for unsupervised learning and dimensionality reduction. SOMs are inspired by the structure and function of the human brain, and they can be used to visualize and explore complex, high-dimensional data in a two-dimensional map or grid.
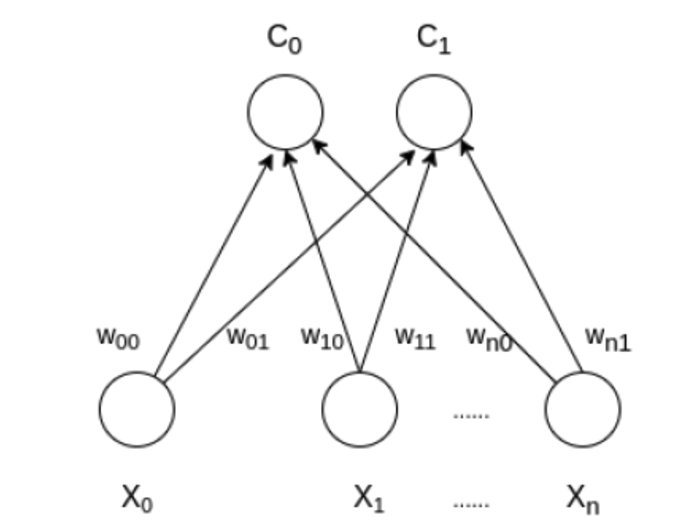
SOMs consist of an input layer, a layer of computational nodes, and an output layer. The input layer receives the data, and the computational nodes perform computations on the data. The output layer is the two-dimensional grid of nodes that represents the input data. During training, the nodes in the output layer are adjusted to represent the input data in a way that preserves the topological relationships between the input data points.
SOMs have a wide range of applications, including image processing, data visualization, data clustering, feature extraction, and anomaly detection. They are particularly useful for clustering and mapping (or dimensionality reduction) techniques to map multidimensional data onto lower-dimensional which allows people to reduce complex problems for easy interpretation.
Implementation
To implement Self-Organizing Maps (SOM) in Python, you can use the SOMPY library. SOMPY is a Python library for Self Organizing Map (SOM), and it provides an easy-to-use interface to implement SOM in Python.
Here are the steps to implement SOM using SOMPY library in Python:
Install SOMPY library: You can install SOMPY library using pip by running the following command in the terminal:
pip install sompy
Import the SOMPY library: To use the SOMPY library, you need to import it first. You can do this using the following code:
from sompy.sompy import SOMFactory
Load data: You need to load the data you want to cluster using SOM. You can load data from a file or create a numpy array.
Create a SOM object: You need to create a SOM object using SOMFactory class. You can set the parameters of SOM object such as the number of nodes, learning rate, and neighborhood function.
som = SOMFactory.build(data, mapsize=[20,20], normalization='var', initialization='pca', component_names=features)
Here, data is the input data you loaded in the previous step, mapsize is the number of nodes in the SOM, normalization is the normalization method, initialization is the initialization method, and component_names is the feature names of the input data.
Train the SOM: You can train the SOM object using the following code:
som.train(n_job=1, verbose=False)
Here, n_job is the number of processors to use, and verbose is the flag to print the training progress.
Plot the SOM: You can visualize the SOM using the following code:
from sompy.visualization.mapview import View2D
from sompy.visualization.bmuhits import BmuHitsView

# View the map
view2D = View2D(10,10,"rand data",text_size=10)
view2D.show(som, col_sz=4, which_dim="all", denormalize=True)

# View the hit map
hits = BmuHitsView(4,4,"Hits Map",text_size=12)
hits.show(som, anotate=True, onlyzeros=False, labelsize=12, cmap="Greys", logaritmic=False)
Here, View2D is used to view the map, and BmuHitsView is used to view the hit map. You can set the number of columns in the map and other parameters to adjust the size and style of the map.
That’s it! These are the basic steps to implement SOM using the SOMPY library in Python. You can customize the SOM object and visualization methods to fit your requirements.
Comments welcome!